Coursework · AI Challenge V2025
PatchCore
A one-day exam: reimplement PatchCore (Roth et al., 2022) from the paper, without using the open-source implementation that already exists. By 8 PM, 99.03% image AUROC and 98.01% pixel AUROC on MVTec AD — within 0.13 points of the official Amazon Science baseline. With a Streamlit dashboard for the operator on top.
Context
The AI Challenge module at ESAIP discloses its subject only on the morning of the exam. By 8 PM the same day, a working POC and a written report must be submitted — no preparation, no preceding course. The 2025 subject was industrial defect detection on MVTec AD.
Before starting, I proposed using anomalib — the open-source PatchCore implementation maintained by Intel's Open Edge Platform team, Apache 2.0, with the best published numbers on MVTec AD and a complete dashboard already in place. The exercise required us to act as if it did not exist. So I rebuilt the method from the paper instead.
Team of three. I led the technical implementation end-to-end — model, evaluation, alignment with the official baseline, Streamlit dashboard — while my teammates supported the surrounding deliverables, including the report that counted for half of the grade.
The problem
Cold-start defect detection on industrial parts is a hard problem because anomalies are rare, varied, and unknown at training time. The standard approach is to learn a representation of "normal" parts and flag anything statistically distant. PatchCore (Roth et al., 2022) set the bar for this approach by combining frozen pretrained features, patch-level memory banks, and coreset reduction.
The approach
Reimplemented the full pipeline in PyTorch, GPU-first, FAISS-free.
Features come from a frozen WideResNet50, layers 2 and 3,
patchified via Unfold with patchsize 3 and stride
1, then reduced per layer to 1024 dimensions before final
aggregation. The coreset is built with approximate greedy
reduction at 10%, projected to 128 dimensions, with 10
starting points. Nearest-neighbor search uses exact L2 via
torch.cdist on CUDA, batched by chunks. Anomaly
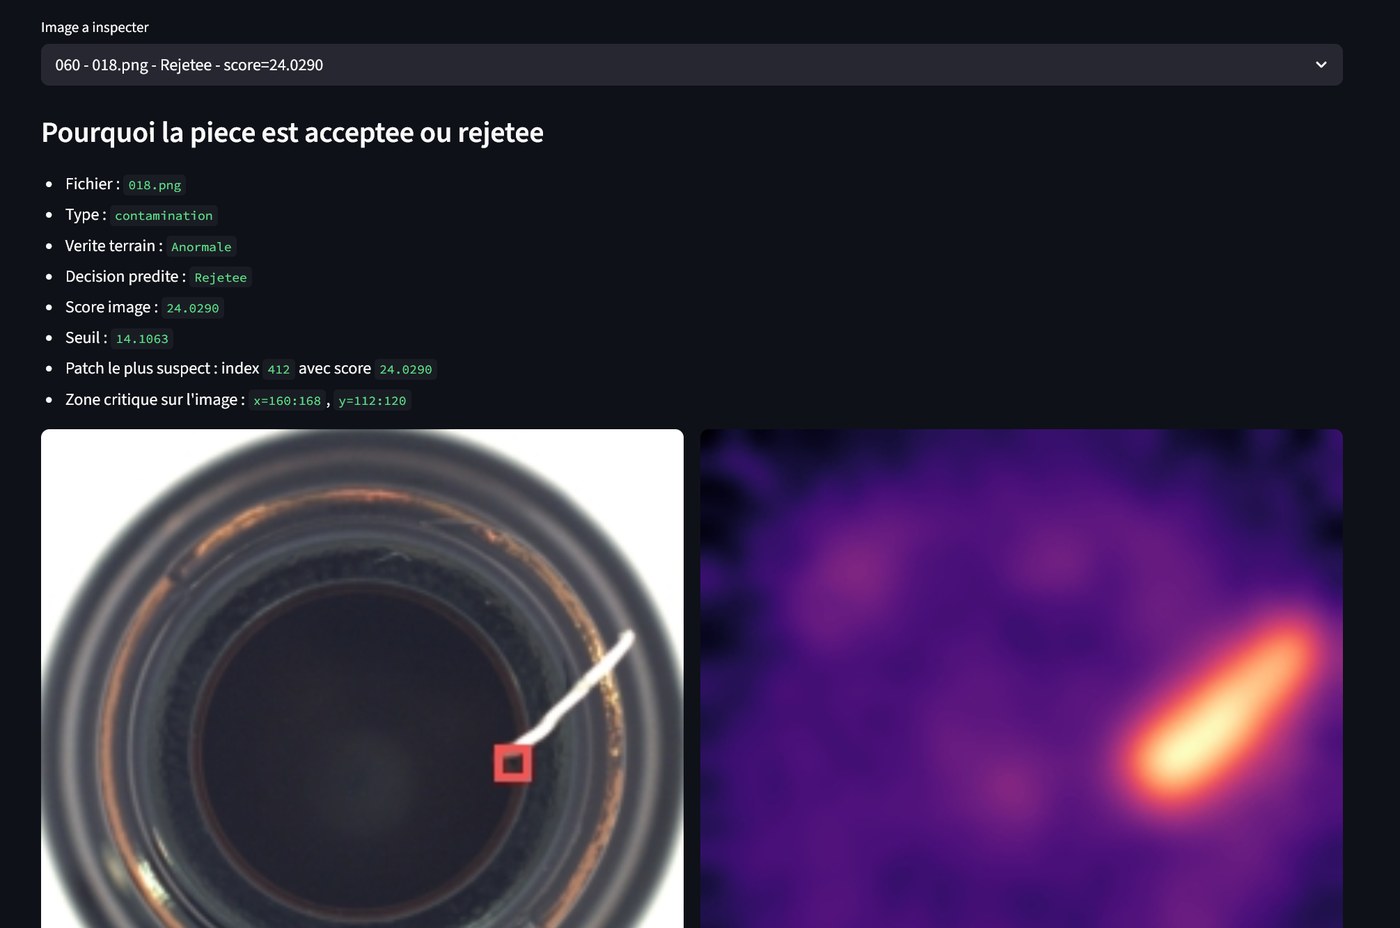
heatmaps use bilinear upsampling to 224×224 and Gaussian
smoothing with σ = 4.
Result
On MVTec AD's 15 categories, average image-level AUROC reached 99.03% and pixel-level AUROC reached 98.01% — within 0.13 percentage points of the official Amazon Science reference. Reached by 8 PM the same day, from the paper.
What made the difference
Closing 0.13 points with the official baseline didn't come from a clever idea — it came from three forms of discipline. Pixel-level AUROC is not as simple as it looks: most reproductions skip edge cases or use library shortcuts that drift from the paper's exact definition. Getting that right was the prerequisite for any meaningful comparison.
The image score uses raw_max over patch scores,
not a reweighted variant — switching to it produced an
immediate jump on the categories that were most behind.
The patch geometry — patchsize 3, stride 1, grid alignment
after Unfold — matches the reference
implementation exactly. Deterministic seeding everywhere kept
the runs reproducible end to end.
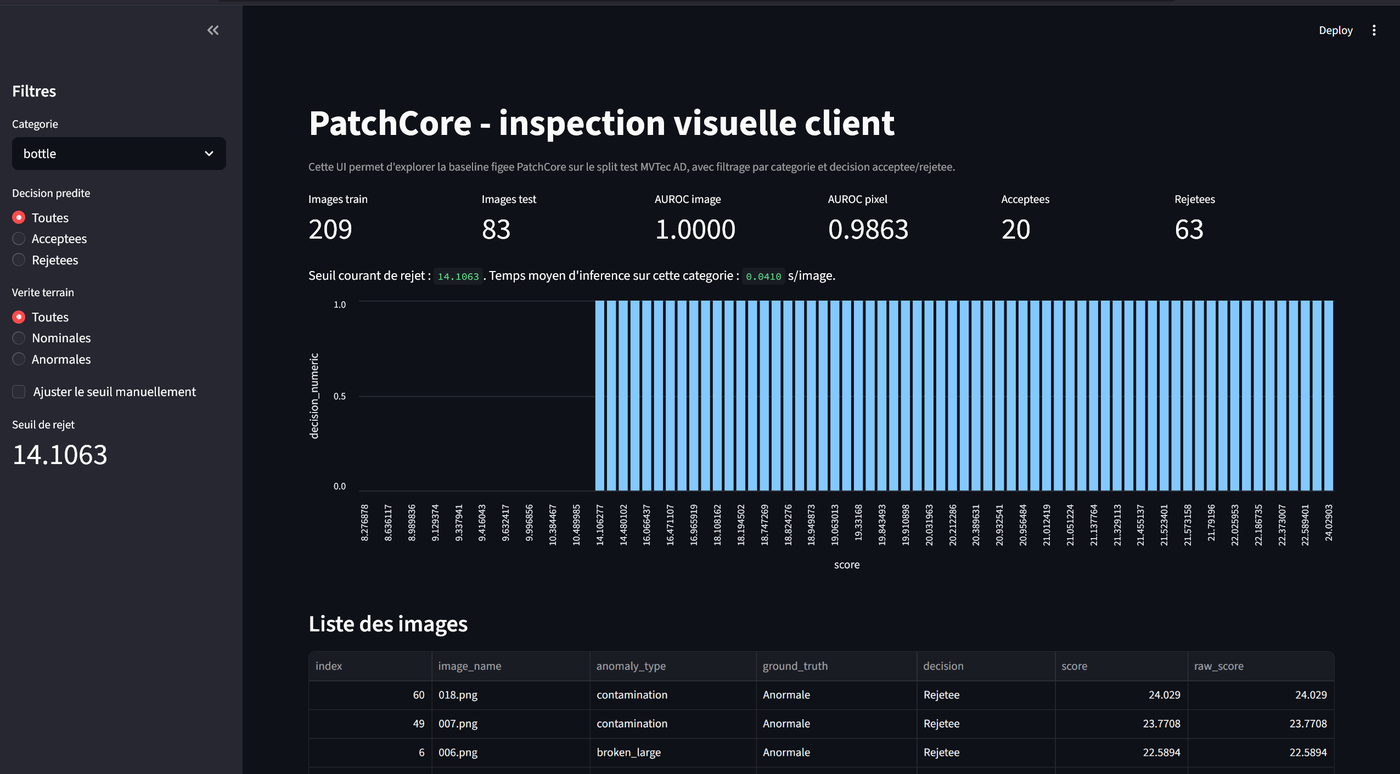
The dashboard
Behind the metrics is the actual deliverable. A Streamlit interface sits on top of the pipeline as a small operator UX, not a demo gimmick. The operator picks a category, scrolls through inspected images alongside their anomaly heatmaps, applies an accept/reject filter, and the screen surfaces the most suspicious patch driving each reject decision. Quality teams looking at this kind of system don't need a static report — they need a screen they can scan and act on.