Coursework · Optimization
Portfolio optimization
Three-level portfolio optimizer on the S&P 500: a convex Markowitz baseline, an NSGA-II solver for non-convex constraints, and a bootstrap robustness layer with VaR. Interactive Streamlit dashboard. One week, team of three.
Context
A one-week project from the optimization module at ESAIP. The brief was to ship a portfolio optimizer that handles the three concerns of a real investor — minimum variance, expected return, and the operational constraints (cardinality, transaction costs) that the textbook Markowitz model ignores — and to wrap the whole thing in an interactive dashboard for a non-technical user. Detailed report and Streamlit application as the two graded deliverables.
Team of three. I built most of the pipeline — the Markowitz baseline, the NSGA-II implementation, the bootstrap robustness layer, and the Streamlit dashboard — and wrote the final report. My teammates supported the surrounding deliverables.
The problem
Markowitz's 1952 mean-variance model is mathematically elegant and operationally fragile. As a convex quadratic program it has a closed-form efficient frontier, but the moment realistic constraints arrive — keep at most K positions in the portfolio, charge a fee on every trade — the problem stops being convex and the QP solver stops working. Worse, the historical mean and covariance fed into the model are noisy estimates: the optimizer happily concentrates on whichever assets happen to look calm in the sample, even when their real variance is much higher.
The approach
The pipeline is built in three levels of increasing realism.
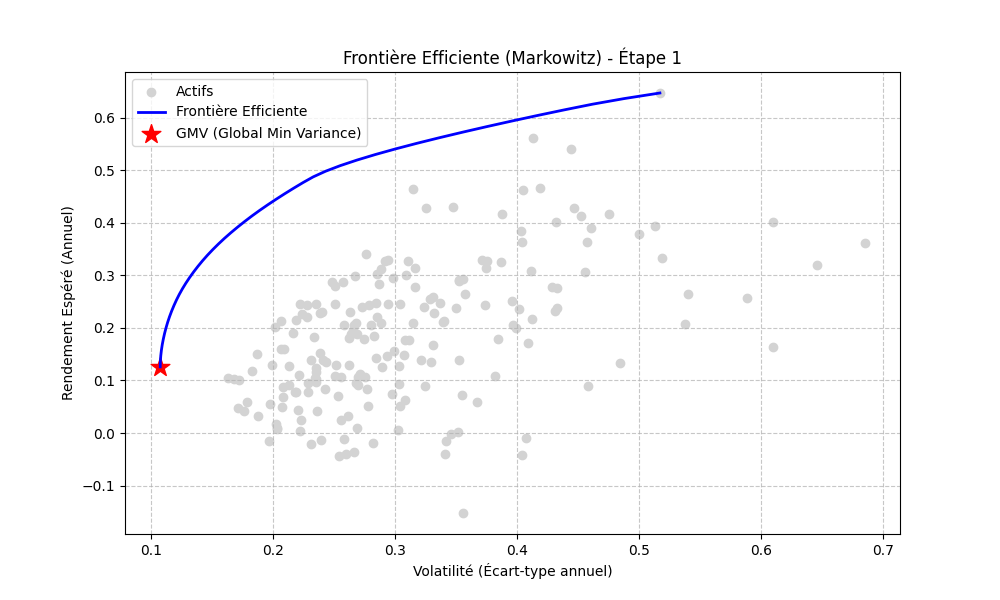
Level 1 — Markowitz baseline. Bi-objective
quadratic program (minimize wTΣw,
maximize wTμ) under budget and
long-only constraints, solved exactly with a QP solver. The
efficient frontier serves as the unconstrained reference: any
realistic portfolio will sit below this curve, and the gap is
the cost of operational constraints.
Level 2 — Non-convex with cardinality and cost.
Add a cardinality constraint (exactly K non-zero
positions) and a transaction-cost objective
(Σ cprop·|wi − wt,i|)
and the problem becomes combinatorial and tri-objective.
Compared four solvers: a relax-and-fix heuristic (fast but
biased toward the QP-relaxed solution), pure Monte Carlo as a
difficulty baseline, "Smart Random" sampling biased by
historical Sharpe, and NSGA-II — a
non-dominated sorting genetic algorithm tailored for
multi-objective optimization.
Level 3 — Bootstrap robustness. Markowitz is sometimes called an "error maximizer": it overweights whatever looked calm in the sample by chance. Bootstrap resampling generates 100 fictional market scenarios by drawing days with replacement from the historical returns, recomputes each candidate portfolio's performance under each, and reports the mean, the standard deviation, and the 95% Value-at-Risk of the estimate. The investor picks not the best on paper, but the most reliable.
Result
On K = 10, the four solvers benchmark cleanly. NSGA-II dominates on frontier quality with a dense, continuous coverage of the Pareto surface; the relax-and-fix heuristic finds extreme anchor points (minimum-variance, maximum-return) but misses the middle; Monte Carlo is a noisy cloud, useful mostly to confirm the problem is genuinely hard; Smart Random sits in between.
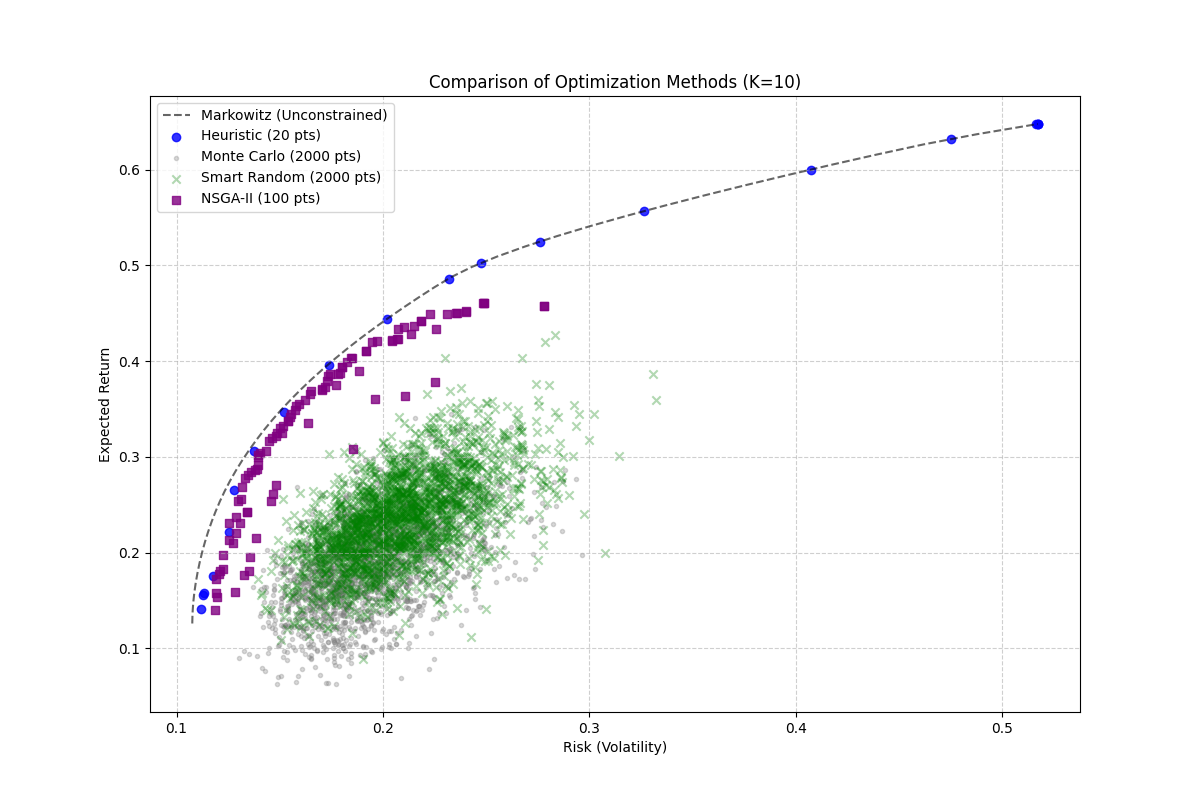
Quantitatively, NSGA-II reached the lowest minimum risk (0.119, against 0.140 for Smart Random and 0.137 for Monte Carlo) and produced the densest Pareto front in roughly half a second of compute time per run. The relax-and-fix heuristic touched a slightly lower min-risk point (0.112) but at the cost of a sparse frontier with only a handful of usable compromises.
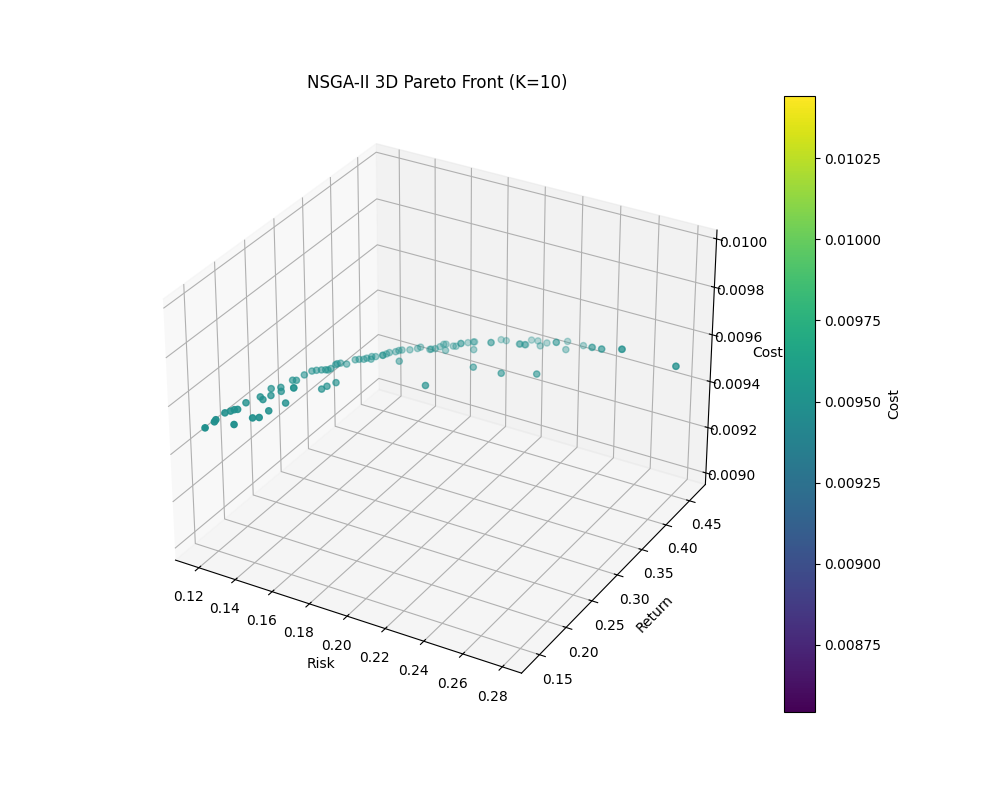
The dashboard
A Streamlit application sits on top of the pipeline. The user picks an asset universe (S&P 500 sectors, custom ticker list, or a sector subset), a time window, and a target cardinality, and the dashboard runs the full three-level pipeline behind the scenes. The 3D Pareto surface is interactive, so the user rotates and inspects the trade-off between risk, return, and cost rather than committing to a single weighted objective up front. The robustness layer renders the Value-at-Risk and the bootstrap distribution next to each candidate portfolio so that the choice is informed rather than overconfident.